
VisualEyes is web-based authoring tool developed at the University of Virginia to weave images, maps, charts, video and data into highly interactive and compelling dynamic visualizations. Click here to watch a short screen-cast about some classic VisualEyes projects and here for some later projects.
VisualEyes enables scholars to present selected primary source materials and research findings while encouraging active inquiry and hands-on learning among general and targeted audiences. It communicates through the use of dynamic displays – or "visualizations" – that organize and present meaningful information in both traditional and multimedia formats, such as audio-video, animation, charts, maps, data, and interactive timelines. The effective use of the visualizations can reveal and illuminate relationships between multiple kinds of information across time and space far more effectively than words alone.
This project was started at the Virginia Center for Digital History and is partially funded by a grant from the National Endowment for the Humanities with continued support from the University of Virginia's Sciences, Humanities & Arts Network of Technological Initiatives (SHANTI). VisualEyes is freely available for academic and non-profit use. To better suport mobile and tablet devices, we have developed a new version of VisualEyes that uses HTML5 rather than the older Flash-based technology. We strongly reccomend using this new version for all future projects
Some projects made using VisualEyes
Click on image to view project
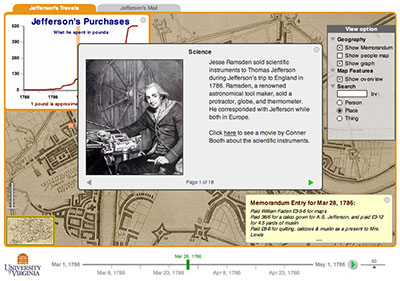
Jefferson's Travels
to England
A visualization of Thomas
Jefferson's
1786 trip
to England
Jefferson's Travels while in
London in 1786
Querying of
property appraisals
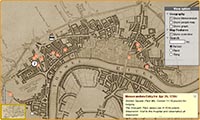
Vinegar Hill:
MemoryScape
Visualization of a 1960's
urban renewal
project
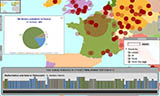
Notes on the
Future of Virginia
The letters between
Jefferson and Short
by Scot French
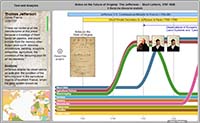
A discourse analysis of the
letters (1787-1826)
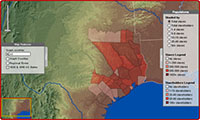
Mapping of slaveholders
and slaves by county
Texas Slavery
Project
A mapping of
slave
ownership
by Andrew Torget
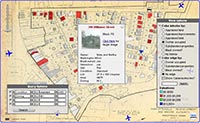
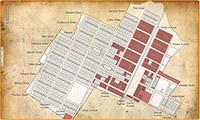
UVa's
First Library
A visualization
of the
1828 University of Virginia
Library and 1895 fire
Mapping the library
in the world
Parksley lot map
1904 sales
Origins of a
railroad town
Parksley, VA
1884-1904
by Brooks Miles Barnes
The Spaces of
Khacloe Drubling
A visualization on the lives of Tibetan nuns
by Kate Hartmann
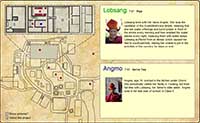
Location of the nuns
at 9:15am
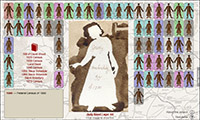
The personfication of
slaves over time
Bleak
House
The personification
of slaves over time
by Alice Cannon, CVHR
Flash required:The live visualizations require Adobe's Flash plug-in v9 or later.
You can download it for free here: http://get.adobe.com/flashplayer
New HTML5 version of VisualEyes
To better suport mobile and tablet devices, we have developed a new version of VisualEyes that uses HTML5 rather than the older Flash-based technology. We strongly reccomend using this new version for all future projects,
Other VisualEyes projects
Morven Farm
A visual cultural landscape report on Morven Farm
Hagley Museum
A visualization of the Dupont Company's gunpowder works on the Brandywine river 1804-1842
Jefferson's Travels to Poplar Forest
Thomas Jefferson's travels to his retirement home
The life of James Smithson
A look at Smithsonian benefactor James Smithson
More information about VisualEyes
- A screencast tour of some VisualEyes Projects
- A Historian's View of VisualEyes (née, HistoryBrowser)
- How VisualEyes Works
- Overview of Making VisualEyes Projects
- VisualEyes in the Classroom
Tools
VisEdit: VisualEyes Project Tool
A tool to create projects in VisualEyes
VisualEyes ProjectSampler
Collection of VisualEyes features with expanatory screencasts
Documentation
VisualEyes Project Guide
How to create projects in VisualEyes
VisualEyes XML Reference
Reference guide to VisualEyes XML structure
VisualEyes GLUE Reference
Reference guide to VisualEyes GLUE scripting
VisualEyes Tutorial
Step-by-step project tutorial by Lisa Rosner/Stockton College
Spreadsheets 101
How to use spreadsheets to organize information for visualization
VisEdit ScreenCast
A 15-minute ScreenCast explaining VisEdit
New visualization book
Interactive Visualization: Insight from inquiry
by Bill Ferster
VisualEyes in the news
NY Tirmes mention 3/22/11
Bill Ferster on NPR's Kojo Nnamdi show 1/12/11
NY Times mention 11/16/10
UVA Today 12/8/09
Contact
Bill Ferster, VisualEyes Project Director
Sciences, Humanities & Arts Network of Technological Initiatives
The University of Virginia
bferster - @ - virginia.edu
Twitter: @bferster
+1 (540) 592-7001
Funded in part by: